之前的筆記
簡單來說,就是把ordinary linear regression的prediction在經過一個non-linear mapping到0~1之間的數字(或是 binary數字,thresholding default = 0.5) 而已:
1-variable example
這個用logistic curve可以得到較好的預測,linear regression不可能對此dataset做出線性decision boundary:假設 P(pass) > 0.5會被classify成 pass,反之則fail,則學習時間 > 3hrs會被此classifier判定成pass。
2-variable example
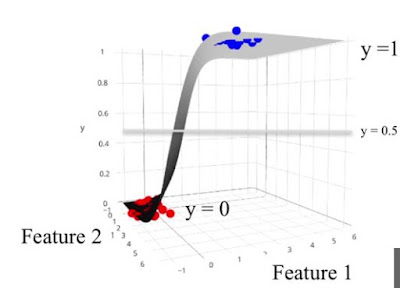
如果把logistic regression的prediction結果 y ( 0~1 ) 一起畫圖出來看的話,會形成一個3-axis graph:所以y=0.5當threshold的話,形成一個plane。如果彷彿形成一個decision boundary:
之前的fruit dataset:
L2 Regularization
logistic regression default就使用了L2 regularization,不過很煩的是,alpha parameter在這邊叫C。注意regularization的意義在於防止overfitting,降低model complexity,在這邊C越大的話,反而regularization越低,penalty越小,不知道為什麼? 可能要看整個公式才知道,anyway反正對logistic regression L2 regularization來說,C值越大,越可能造成overfitting。
不過上圖的結果反而是C=100時有較好的test set score,總之是要實驗一下就是了。


沒有留言:
張貼留言